Blog post
Using Spatial Data in Business Intelligence Platforms
How Archilogic provides spatial data for interior spaces, and how it can be integrated into business intelligence platforms such as Microsoft Power BI, Grafana, and Retool to improve data visualization, space management, and decision-making.
What is spatial data?
Spatial data, in the context of interior space, refers to data that provides information about the physical layout and characteristics of indoor spaces. This can include data such as the dimensions of rooms, the location of furniture, the flow of foot traffic, and the position of doors and windows. Spatial data is increasingly being used in interior design, architecture, and facility management to optimize space usage, improve efficiency, and enhance the user experience.
How Archilogic provides spatial data
Archilogic digitizes floor plans and turns them into digital twins that aren’t simply static representations of space. They are dynamic data models containing data elements representing all of the spatial elements in the digital twin including buildings, floors, spaces, and assets. These data elements contain geometric and relational data, as well as metadata. The data is combined to create an intuitive model capable of generating information about space in various forms.
Spatial elements
Space can be thought about in terms of its constituent elements, most typically buildings, floors, spaces, and assets. Each element contains three types of information:
- Geometric data - information about the size, shape, and position of an element in space, expressed as a series of geospatial coordinates.
- Relational data - information about how one element relates to another. Examples include the assets that exist within a space, or the spaces that exist within a floor.
- Metadata - a set of attributes of an element, such as the address of a building, the elevation of a floor, or the program type of a space.
Floor plans
Archilogic combines the geometric and relational data about a space’s elements with its metadata to generate floor plans dynamically. These floor plans can be accessed directly in Archilogic through a viewer and an editor, downloaded and shared in common file formats like PDF, PNG, DXF, or IFC, or they can be integrated into other products and services.
How Archilogic can be used in BI platforms
What is a BI platform?
In the realm of business intelligence (BI), a BI platform is a software system that allows organizations to collect, analyze, and visualize data from various sources. BI platforms provide a range of tools and functionalities for processing data, generating reports, and gaining insights that can be used to inform decision-making and drive business growth.
Integrating Archilogic with BI platforms
Archilogic can be integrated into BI platforms to provide a range of benefits, such as enhancing data visualization and analysis, improving space management and allocation, and supporting decision-making.
As a data source
Archilogic provides a REST API that can be connected to any BI platform so the underlying information about the spatial elements in a digital twin can be accessed programatically. This enables users of BI platforms to connect detailed information about a space and its characteristics to any other source of data in order to perform power analyses about space.
As a visualization
Archilogic provides prebuilt, off-the-shelf components and plugins specific to a number of BI platforms that make adding a floor plan to a dashboard or business report as easy as clicking a button. Any changes that are made to the space in Archilogic’s editor are immediately propagated to any dashboard or report where that space’s floor plan has been added.
Using Archilogic in specific BI platforms
Microsoft Power BI
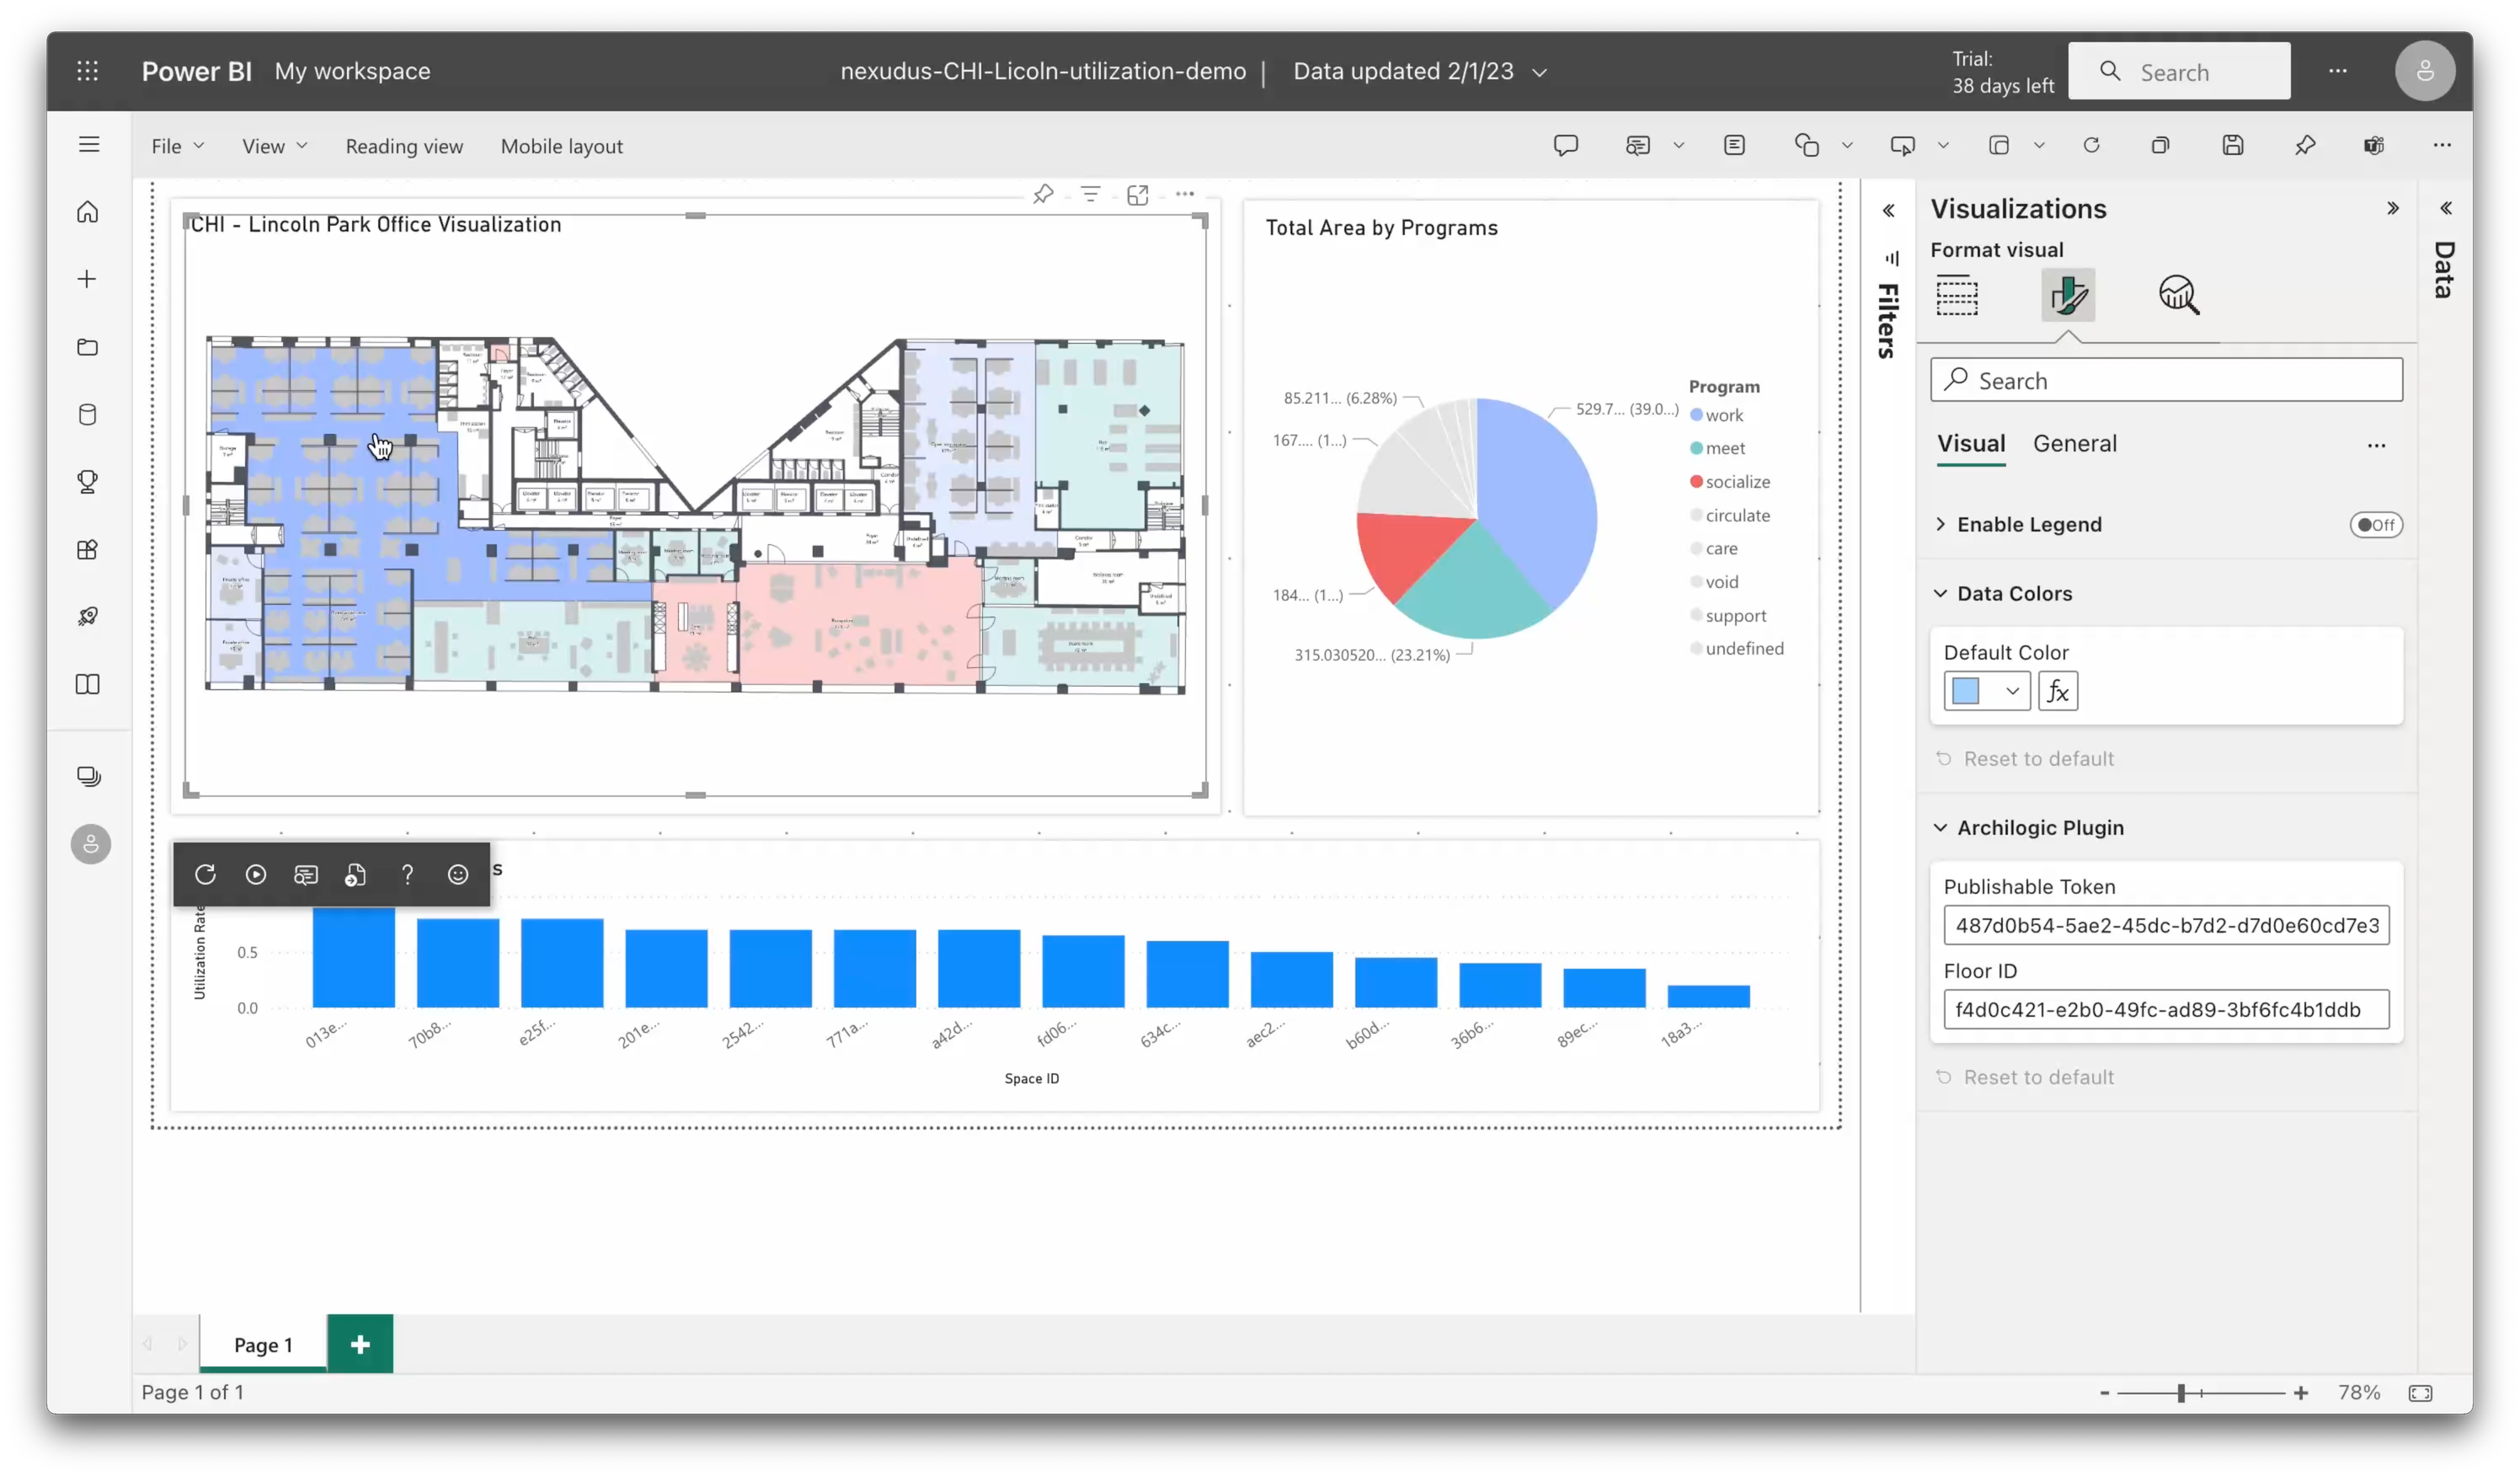
Microsoft Power BI is a business analytics service that provides a suite of tools for creating interactive visualizations and reports. It allows users to connect to a wide range of data sources, including databases, web services, and cloud-based applications, and to create custom dashboards and reports that provide insights into business performance and operations.
Power BI can use Archilogic's digital twins to create interactive visualizations that enable users to explore and analyze interior spaces in more detail.
Click here to learn more about how to add Archilogic data and/or floor plans to a Microsoft PowerBI report.
Grafana
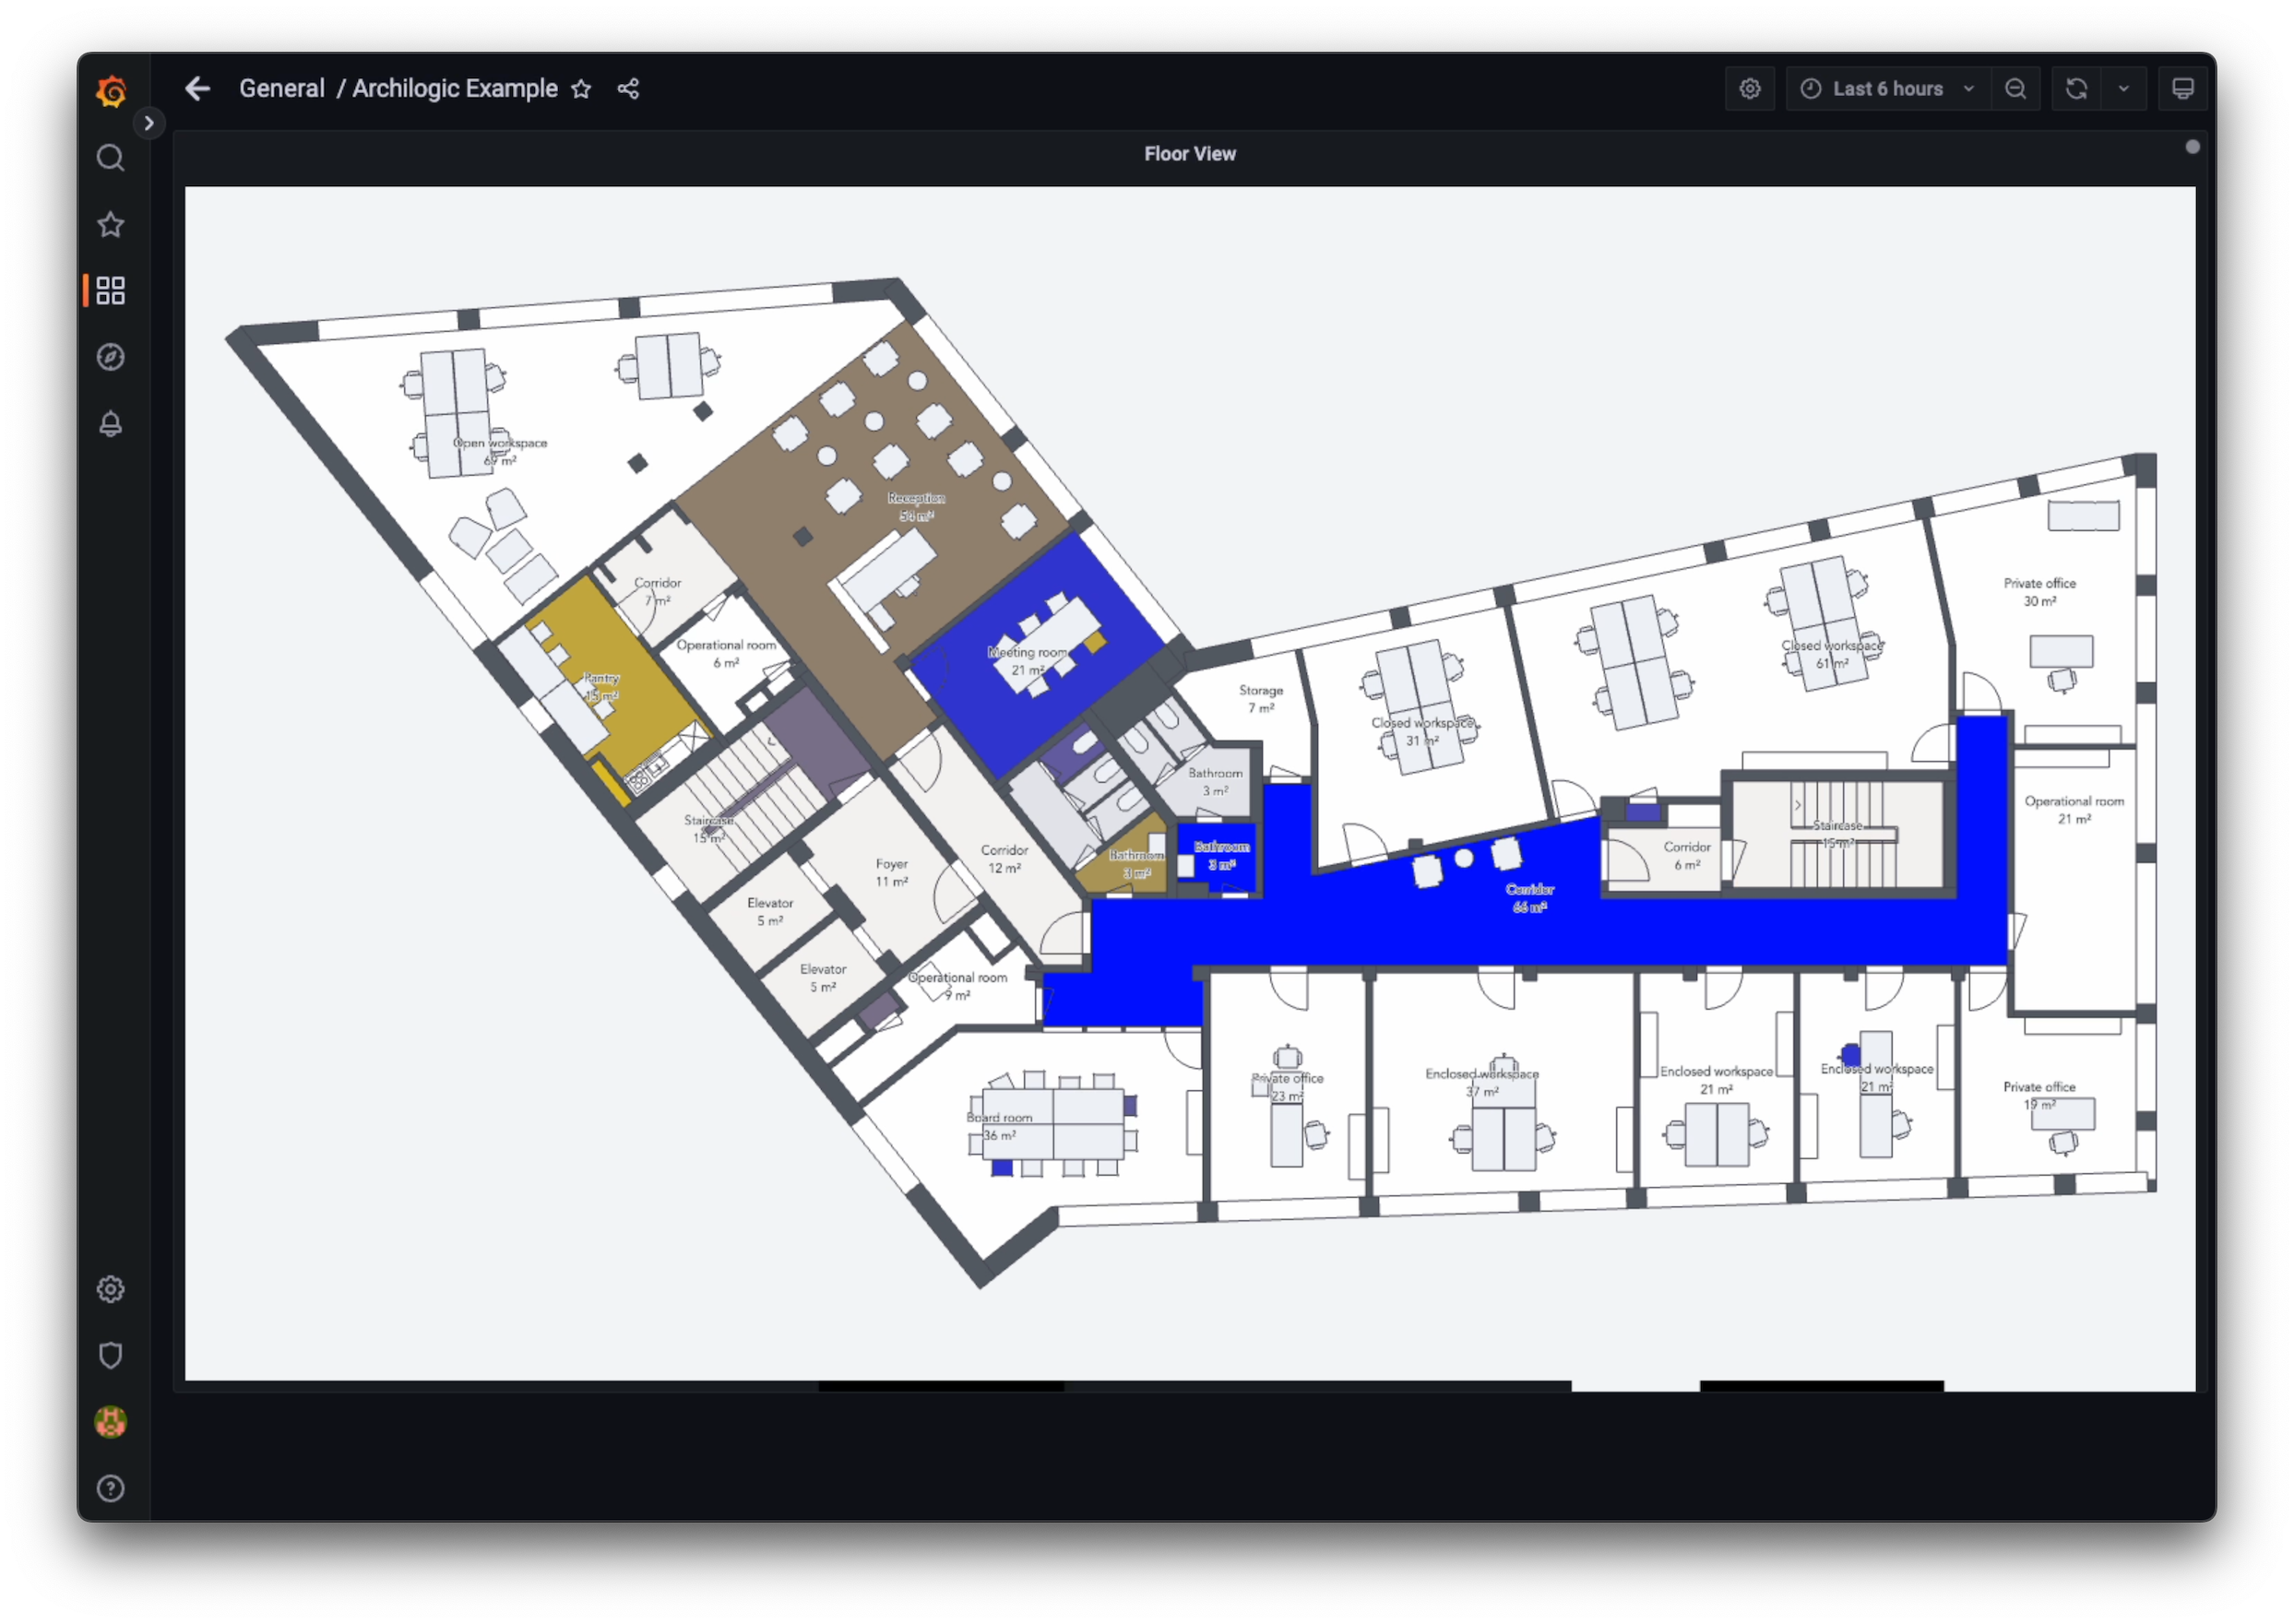
Grafana is an open-source platform for data visualization and analytics. It allows users to create custom dashboards that provide insights into business operations and performance, and to connect to a wide range of data sources, including databases, cloud-based applications, and IoT devices.
Grafana can use Archilogic's digital twins to create custom dashboards that provide real-time insights into space utilization, occupancy rates, and other key performance indicators.
Click here to learn more about how to add Archilogic data and/or floor plans to a Grafana dashboard.
Retool
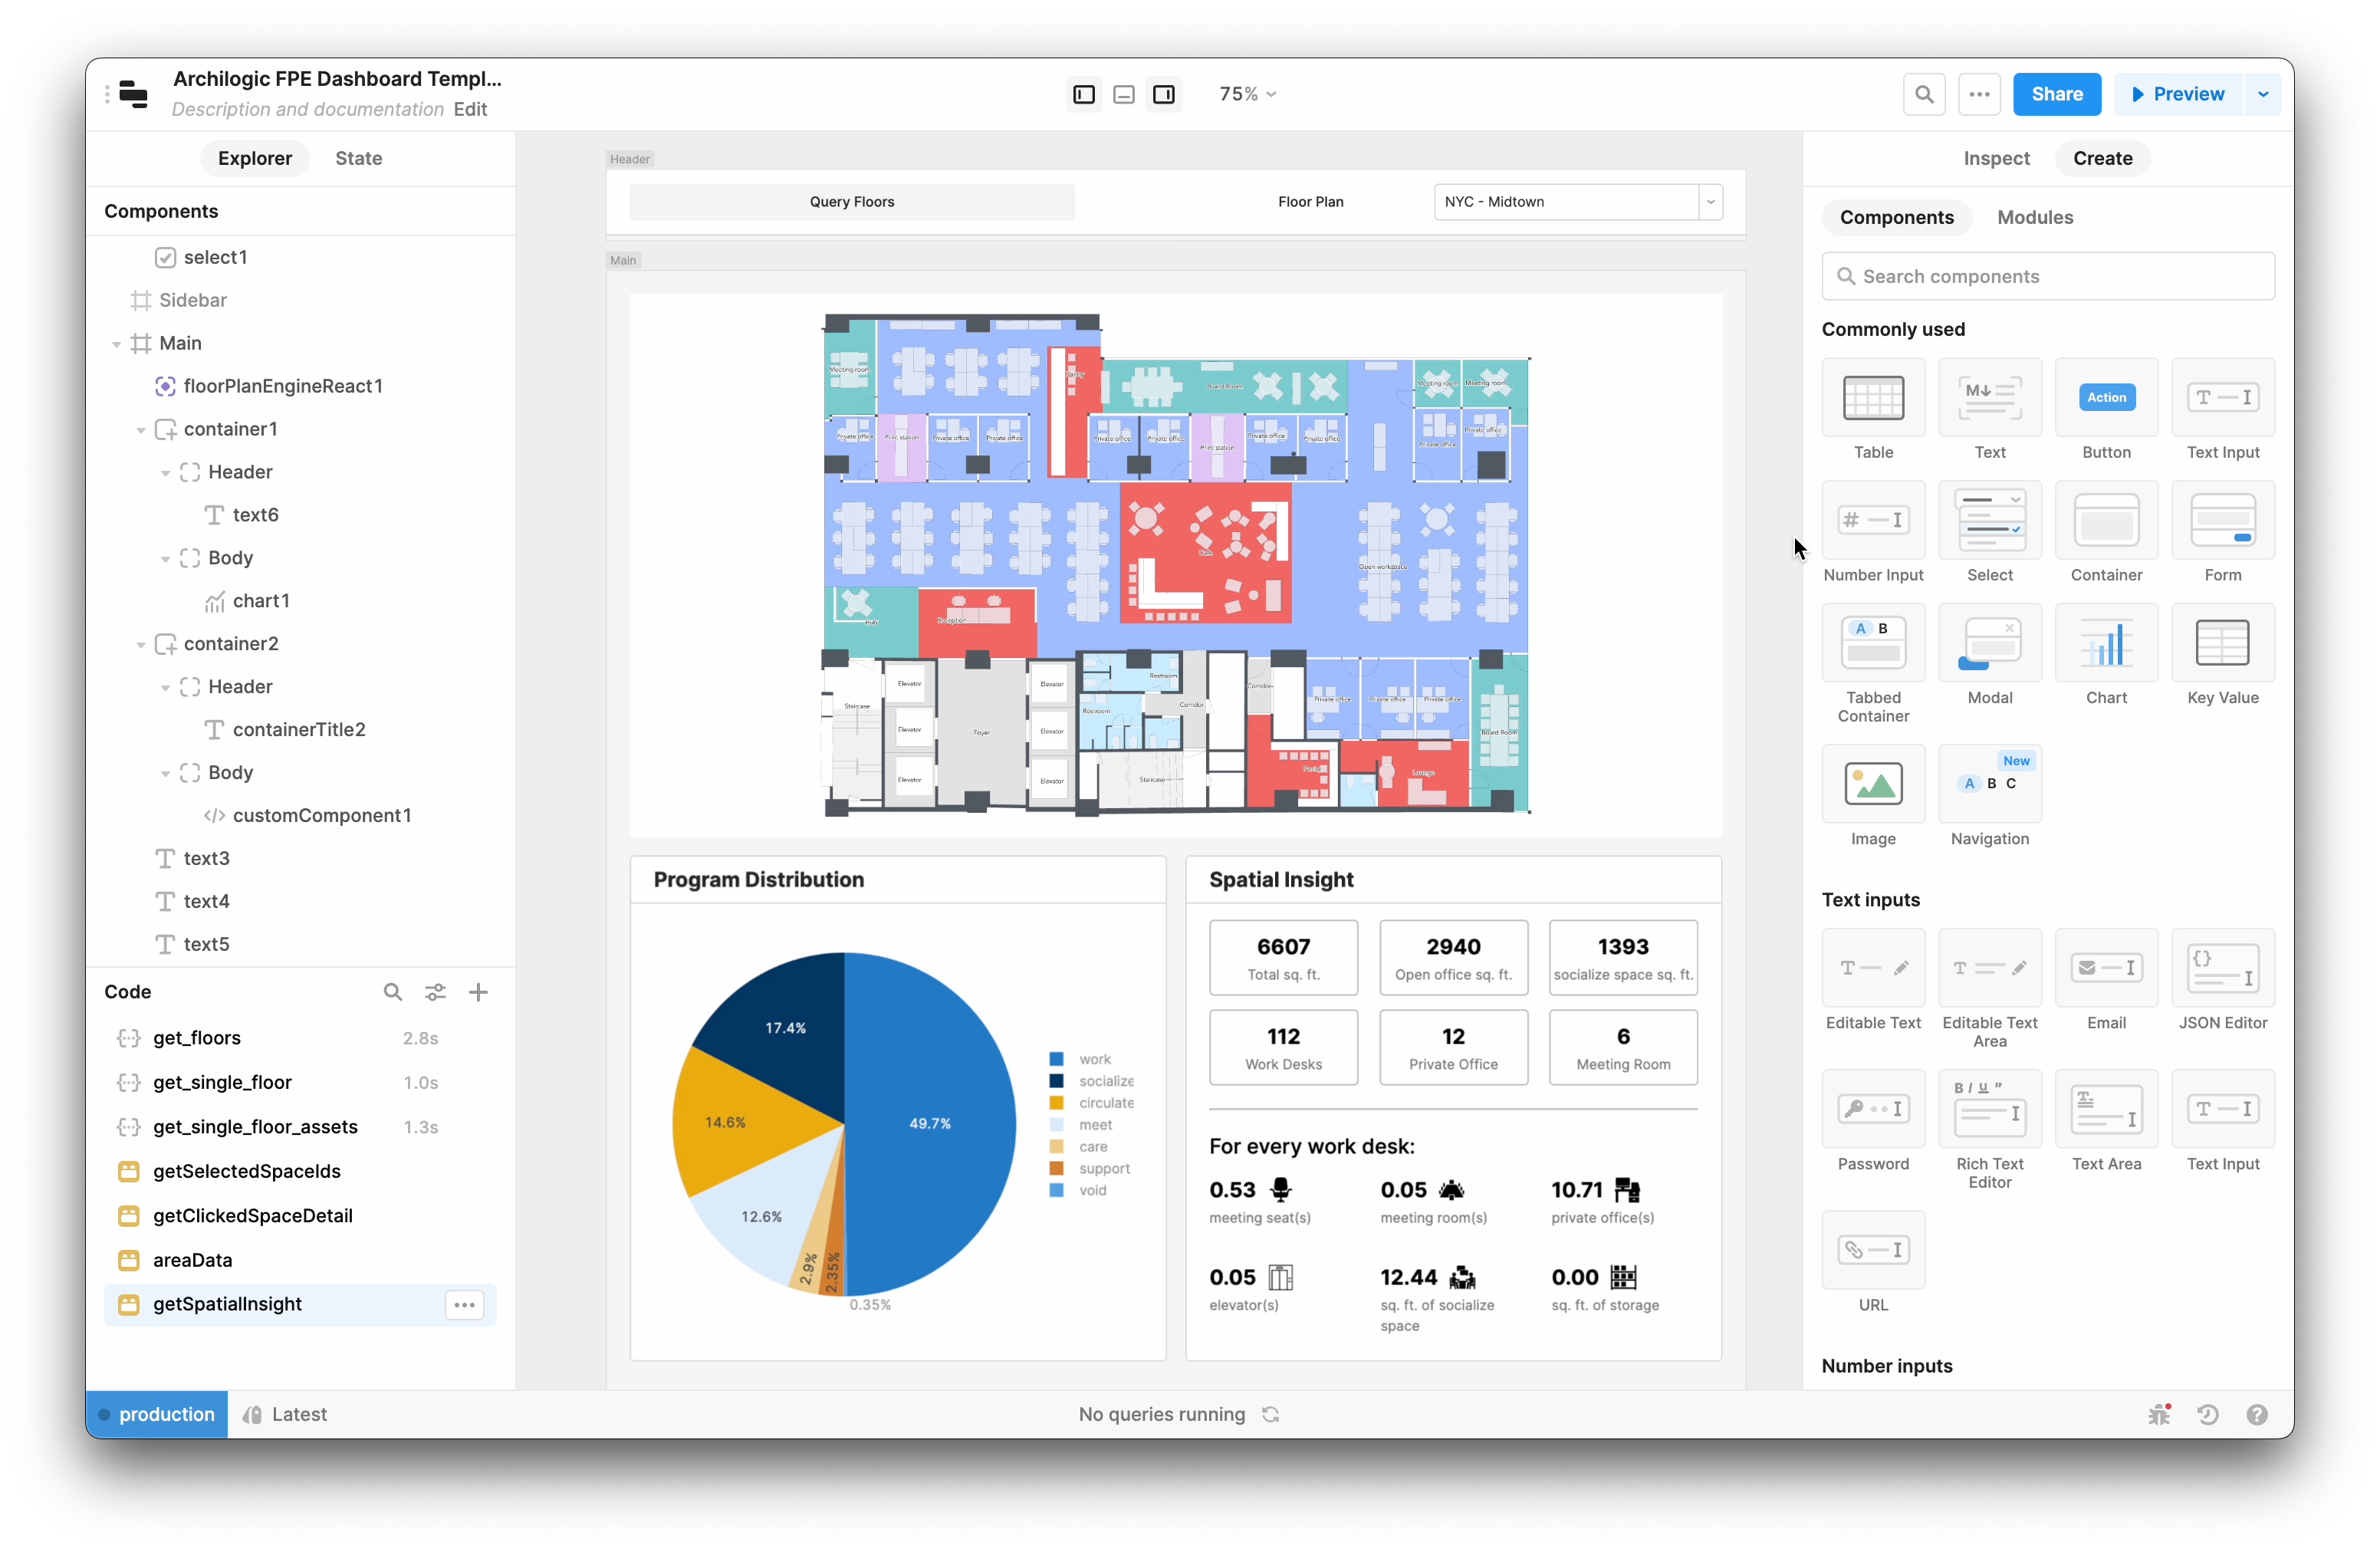
Retool is a low-code development platform that allows users to build custom internal tools, such as dashboards and data entry forms, using a drag-and-drop interface. It allows users to connect to a wide range of data sources, including databases, APIs, and cloud-based applications, and to create custom applications that automate business processes and enhance productivity.
Retool can use Archilogic's digital twins to create custom applications that enable users to explore and analyze interior spaces in more detail.
Click here to learn more about how to add Archilogic data and/or floor plans to a Retool dashboard.